Ultimate Guide to LinkedIn Automation KPIs
Track six core KPIs to know if your outreach is actually working: connection acceptance rate, reply rate, meeting conversion rate, cost per lead, time saved per week, and ROI. This guide explains what good looks like for each metric and how to use the data to improve campaigns rather than just report on them.
Track six core KPIs to know if your outreach is actually working: connection acceptance rate, reply rate, meeting conversion rate, cost per lead, time saved per week, and ROI. This guide explains what good looks like for each metric and how to use the data to improve campaigns rather than just report on them.
Track six core KPIs to know if your outreach is actually working: connection acceptance rate, reply rate, meeting conversion rate, cost per lead, time saved per week, and ROI.
This guide explains what good looks like for each metric and how to use the data to improve campaigns rather than just report on them.
Table of Contents
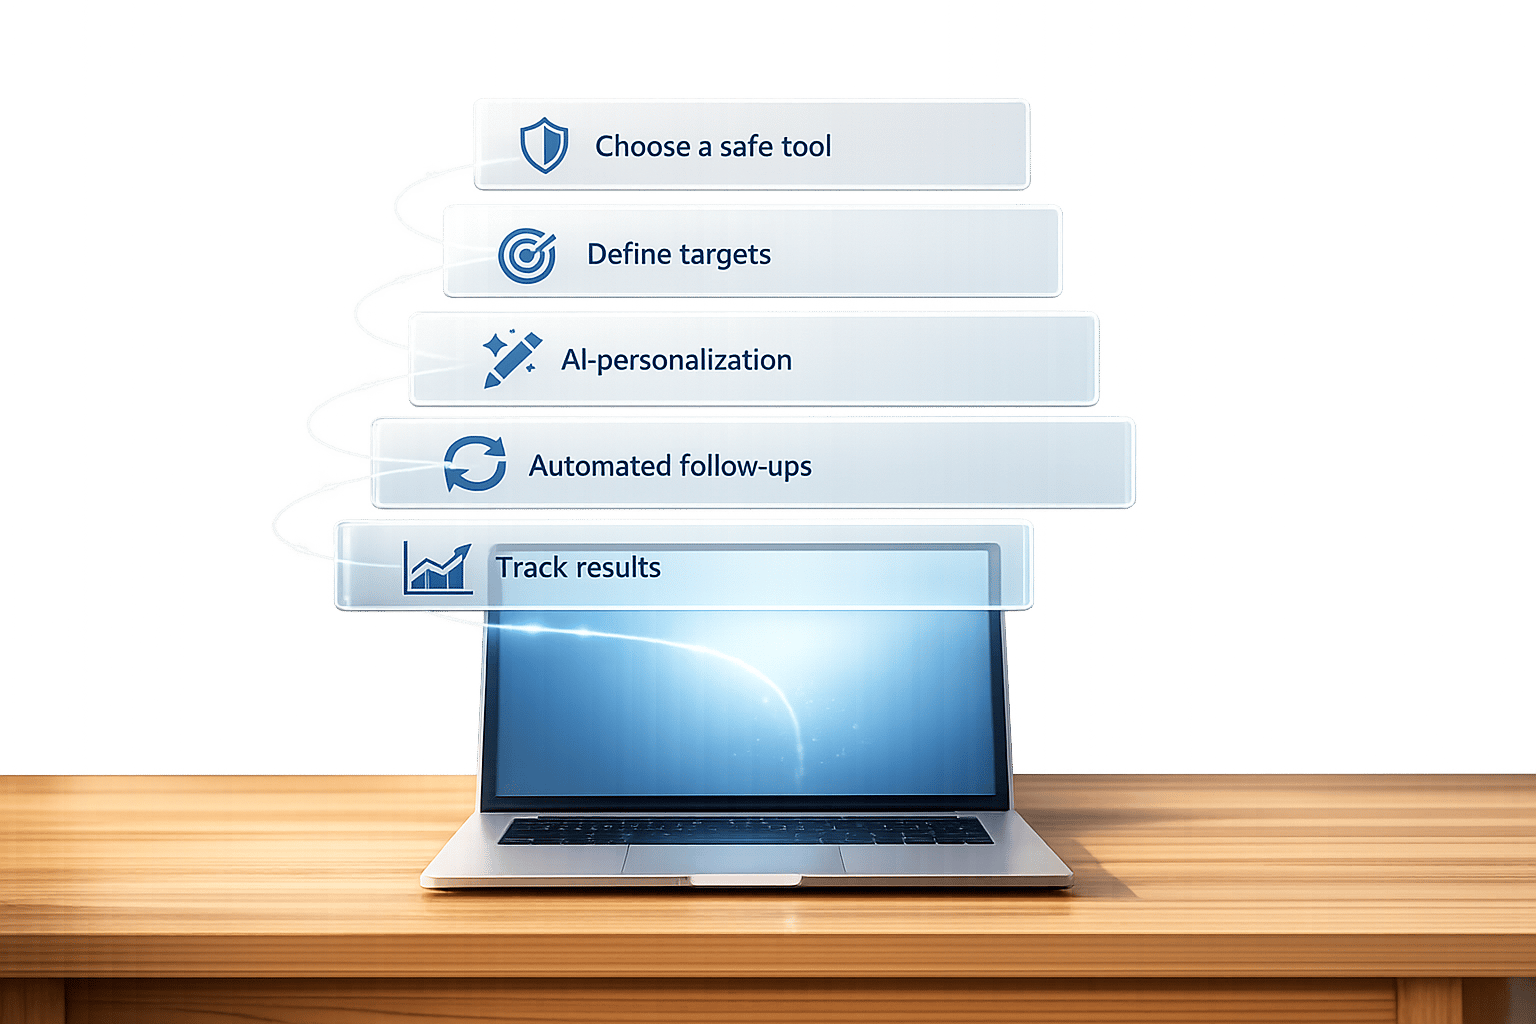
LinkedIn automation is a game-changer for B2B lead generation, but tracking the right KPIs is essential to ensure your efforts deliver results. Here’s what you need to know:
- Connection Acceptance Rate: Measures how many users accept your connection requests. A good rate is 30%-50% or higher. Improve this by refining your profile and targeting.
- Message Response Rate: Tracks how many recipients reply to your messages. Aim for 30%+; personalized, concise messages perform best.
- Lead Conversion Rate: Shows the percentage of connections turning into qualified leads. Typical rates range from 2%-12%, depending on industry and approach.
- Cost per Qualified Lead (CPL): Calculates the cost of generating each lead. B2B campaigns often aim for $50-$100 CPL.
- Time Saved Through Automation: Automation reduces manual time spent prospecting, freeing up hours for higher-value tasks.
LinkedIn Automation KPIs Benchmarks and Performance Metrics Guide
9 Metrics you SHOULD Measure for LinkedIn Cold Outreach Campaigns [+FREE ROI Calculator]
Core LinkedIn Automation KPIs to Monitor
Tracking the right KPIs is what separates successful LinkedIn automation from wasted effort. By focusing on these metrics, you can identify what’s working and where you need to improve.
Connection Request Acceptance Rate
The connection request acceptance rate shows how many people accept your invitations compared to the total you send. To calculate it, divide the number of accepted requests by the total sent, then multiply by 100. For instance, sending 100 requests and getting 35 acceptances gives you a 35% acceptance rate.
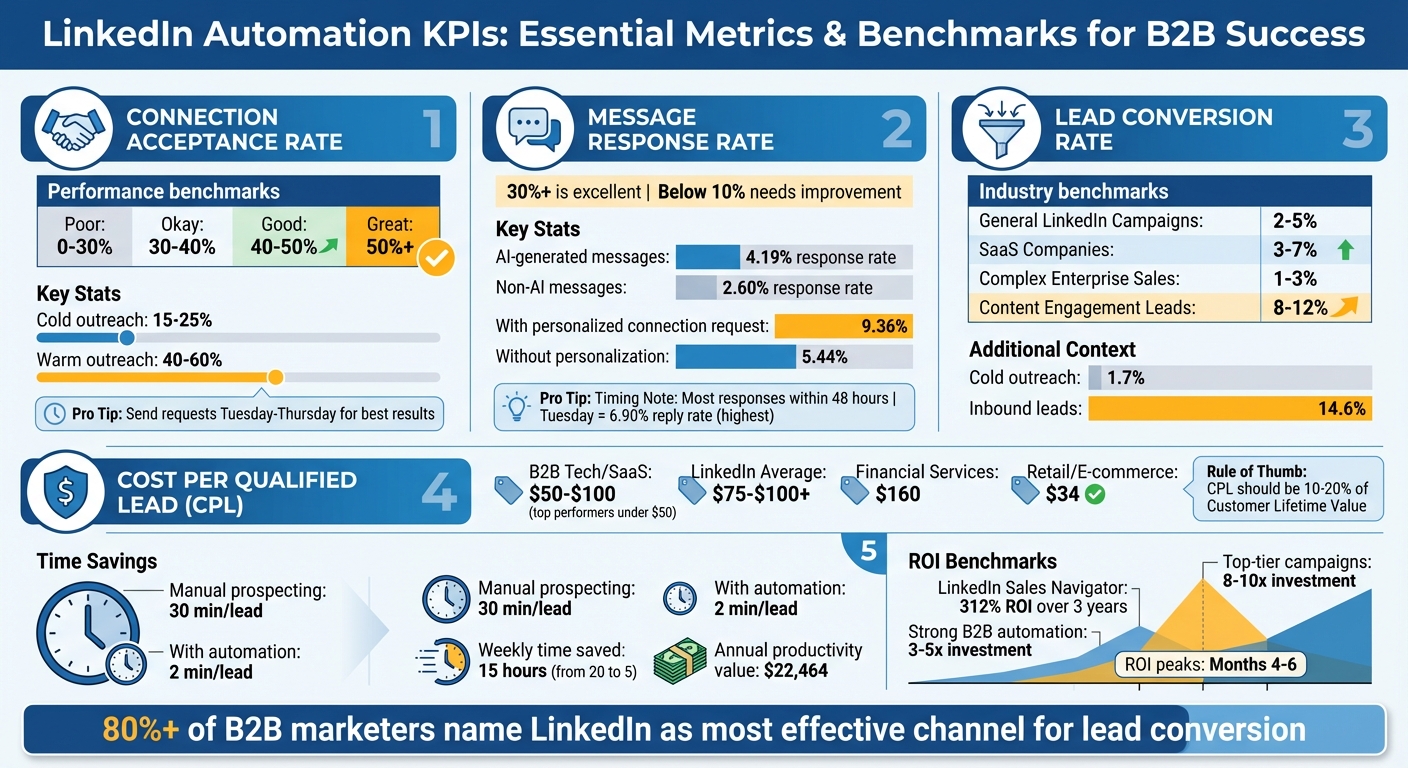
If your rate is low, it could mean your targeting is off or your profile isn’t appealing enough. Make sure your profile photo, headline, and activity are engaging. Typical acceptance rates for cold outreach range from 15% to 25%, while warm outreach - targeting those who’ve interacted with your content - can hit 40% to 60% [5].
Here’s a quick benchmark:
| Performance Level | Connection Acceptance Rate |
|---|---|
| Poor | 0% - 30% |
| Okay | 30% - 40% |
| Good | 40% - 50% |
| Great | 50%+ |
Timing plays a role too. Professionals are most active on LinkedIn from Tuesday to Thursday, so sending requests during this window can improve results [5]. If your rate falls below 30%, revisit your targeting and refine your profile before scaling your efforts.
Once you’ve established connections, the next step is to see how well your messages spark conversations.
Message Response Rate
Message response rate measures how many people reply to your outreach messages. Calculate it by dividing the number of replies by the total messages sent, then multiplying by 100. For example, if you send 100 messages and get 20 replies, your response rate is 20%.
It’s helpful to separate total reply rate from positive reply rate to better gauge genuine interest. Positive replies offer a clearer picture of engagement quality.
Research shows that outreach campaigns combining direct messages with profile visits achieve an 11.87% reply rate. AI-generated first messages perform better, with a 4.19% response rate compared to 2.60% for non-AI messages [6].
"In LinkedIn outreach, personalizing questions and making them open to opinion increases the likelihood of a response, and AI is a valuable tool for achieving this personalization."
– Gerda Vaidotaitė, Customer Support and Strategies Specialist, Expandi [6]
Adding a personalized message to your connection request can also help, boosting reply rates to 9.36% compared to 5.44% without one [6]. A reply rate of 30% or higher is considered excellent, while rates below 10% suggest your messaging needs improvement [1].
Most responses come within 48 hours of the initial message [4]. If you’re not seeing replies within that time, tweak your approach. Interestingly, Tuesday tends to have the best reply rates, averaging 6.90% [6].
Lead Conversion Rate
Beyond engagement, the lead conversion rate ties your outreach efforts to revenue. This metric tracks the percentage of connections that turn into qualified leads or customers. To calculate it, divide the number of qualified leads by your total connections, then multiply by 100.
General LinkedIn campaigns typically convert at rates of 2% to 5%. SaaS companies often see 3% to 7%, while complex enterprise sales cycles hover between 1% to 3%. Meanwhile, leads generated through content engagement can reach conversion rates of 8% to 12% [5].
| Industry Segment | Typical Lead Conversion Rate |
|---|---|
| General LinkedIn Campaigns | 2% - 5% |
| SaaS Companies | 3% - 7% |
| Complex Enterprise Sales | 1% - 3% |
| Content Engagement Leads | 8% - 12% |
(Source: Leadsforge [5])
To track this effectively, use CRM tools that connect LinkedIn activity directly to revenue outcomes [4]. If your conversion rate is on the lower end for your industry, the issue might be with lead qualification rather than outreach volume. Increasing nurturing actions, like follow-ups, from one to five can boost reply rates from 1.07% to 5.26% [6], which can directly improve your conversion outcomes.
Together, these three KPIs - acceptance rate, response rate, and conversion rate - offer a clear diagnostic framework. For instance, if your acceptance rate is high but response rate is low, your profile may be attracting the right audience, but your messaging isn’t connecting. On the other hand, high response rates with low conversions suggest strong engagement but weak lead qualification. By understanding these dynamics, you can focus your efforts where they’ll have the most impact.
Efficiency and ROI Metrics
Tracking engagement is just the start. To truly gauge the value of LinkedIn automation, you need to measure how much time and money it saves. These metrics reveal the business impact of your outreach efforts.
Time Saved Through Automation
Think about this: manual prospecting takes around 30 minutes per lead, including research, personalization, and follow-ups. Automation can slash that to just 2 minutes per lead [2]. For example, a sales rep spending 20 hours a week on prospecting could cut that down to just 5 hours with automation. That’s 15 extra hours they can devote to closing deals [8].
Now, let’s put a dollar value on that saved time. If a rep earns $60,000 a year, their hourly rate is about $28.85. Saving 15 hours a week translates to roughly $432 in weekly labor savings - or $22,464 annually in reclaimed productivity.
Automation also ensures consistent follow-ups through sequences, which can directly boost the number of qualified meetings. Many teams see their monthly qualified meetings jump from 5 to 15 after implementing automation [8].
Once you’ve quantified time savings, the next step is to evaluate cost efficiency using the Cost per Qualified Lead metric.
Cost per Qualified Lead (CPL)
Cost per Qualified Lead (CPL) measures how much it costs to generate each sales-qualified lead. To calculate it, divide your total investment - covering both direct and indirect costs - by the number of qualified leads produced.
Don’t forget to include all associated expenses. These range from subscription fees to indirect costs like SDR labor, management oversight, content creation, and training. Indirect costs can be 10 to 50 times higher than software subscription fees [9][10]. For example, if a rep earning $60,000 spends 40% of their time on LinkedIn, that’s $24,000 annually in labor costs [9].
"Your actual CPL should include: Ad spend, agency management fees, creative production costs, software subscriptions, and attribution and tracking tools."
– Hadis Mohtasham, Marketing Manager, Cufinder [11]
What’s a good CPL? It varies by industry. For B2B tech and SaaS, a CPL of $50 to $100 is considered solid, with top-performing campaigns hitting under $50. Financial services average about $160 per lead, while retail and e-commerce CPLs hover around $34 [11][12]. On LinkedIn, CPLs typically range from $75 to over $100 [11].
To track CPL accurately, use standardized CRM tags like "LinkedIn_Automation_Q1" to properly attribute revenue [9][11]. As a rule of thumb, a healthy CPL should fall between 10% and 20% of your Customer Lifetime Value [11].
Once you’ve nailed down your CPL, it’s time to assess the broader financial picture with Automation ROI.
Automation ROI
Return on investment (ROI) is the ultimate test of whether your automation efforts are worth it. The formula is simple: (Revenue from Leads – Total Cost) ÷ Total Cost × 100 [7].
Consider this: a Forrester study found that LinkedIn Sales Navigator delivered a 312% ROI over three years, paying for itself in less than six months [9]. For B2B companies, a strong LinkedIn automation ROI typically ranges from 3 to 5 times the initial investment. Top-tier campaigns can even hit 8 to 10 times [7].
ROI tends to peak between months four and six as your network expands and messaging strategies improve [7]. When evaluating new tools, aim for at least a 30% improvement in key metrics like qualified meetings or time saved - this is known as the "30% rule" [8].
To estimate ROI before deals close, use probability-weighted pipeline values. For instance, a $100,000 opportunity with a 60% close probability contributes $60,000 to your ROI calculation [9]. This allows you to measure returns in real time instead of waiting for deals to close.
With over 80% of B2B marketers naming LinkedIn as their most effective channel for lead conversion [7], it’s clear why automation on this platform is a smart investment. The trick is to track the right metrics and account for all costs, including hidden labor expenses, to get a complete picture of your ROI.
sbb-itb-817c6a5
How to Benchmark and Improve Your KPIs
Setting Data-Driven KPI Benchmarks
Measuring performance accurately is the first step in setting realistic benchmarks. For instance, cold outreach typically converts at 1.7%, while inbound leads perform much better, converting at 14.6% - a difference of 8.6 times [14]. To get meaningful insights, you’ll need separate benchmarks for different outreach types.
For 2026, here’s what strong performance looks like: connection acceptance rates should fall between 30% and 45%, with personalized requests reaching the higher end of that range at 45% [13][15]. For reply rates, successful campaigns usually land between 30% and 50% [13]. Of course, these numbers can shift significantly depending on your target audience and industry.
Speaking of industries, benchmarks can vary widely. Legal and Professional Services enjoy a response rate of 10.42%, while Software and SaaS lag behind at just 4.77% [15][6]. Job roles also matter. HR and Talent Acquisition professionals respond at a rate of 12.08%, but reaching C-level executives is much tougher [15][6]. If your focus is on saturated markets or senior-level positions, it’s wise to set more conservative expectations.
The format of your message also plays a big role. Keep your outreach concise - under 400 characters - because 57% of LinkedIn traffic comes from mobile users [15]. Messages that fit on one screen without requiring scrolling can improve response rates by 22% [15]. Timing matters too. Sending your initial outreach on a Tuesday yields the highest reply rate at 6.90%, but Mondays and Thursdays aren’t far behind at 6.85% [15][6].
Here’s a small but effective tip: check out a prospect’s profile before sending an InMail. People are 78% more likely to accept InMail from someone who has viewed their profile in the last 30 days [15]. This simple step can elevate your metrics without requiring you to change your message at all.
Once you’ve established these benchmarks, the next step is using real-time data to fine-tune your strategies.
Using Real-Time Data to Improve Outreach
While benchmarks provide a baseline, real-time data helps you refine your approach on the fly. Most responses come in within 48 hours, giving you a quick window to assess and adjust [4].
Start by testing one change at a time to pinpoint what drives better results. For example, if your reply rate is below 10%, it’s a sign that your messaging needs improvement [5]. Real-time tracking can also show you when to act decisively. Well-timed follow-ups, for instance, can boost reply rates by over 50% [16]. If certain message formats or industry segments outperform your benchmarks, it’s a good idea to reallocate more resources there. On the flip side, campaigns that underperform after 48 hours should be paused so you can focus your efforts elsewhere.
Taking a multichannel approach can supercharge your results. Combining LinkedIn outreach with email and phone calls can increase engagement rates by more than 200% [16]. Use your data to figure out which combinations work best for your audience, then weave those insights into your overall strategy. The goal isn’t just to meet industry averages - it’s to consistently outperform them by learning what resonates with your specific target market.
How SalesMind AI Improves KPI Tracking
Tracking key performance indicators (KPIs) manually can slow down decision-making and leave room for error. SalesMind AI tackles this problem head-on with a system that brings all your data together, eliminating the inefficiencies of juggling multiple tools. By consolidating everything into a single platform, it provides the visibility you need to monitor performance and tweak campaigns in real time. This approach builds on the earlier emphasis on making data-driven adjustments.
Unified Inbox for Centralized Tracking
SalesMind AI’s unified inbox simplifies LinkedIn communication by gathering messages from multiple accounts into one place. Instead of switching between accounts or platforms, you can manage all interactions in a single interface. Features like automatic tagging and integrated analytics remove the hassle of manually organizing data. Rahul Pushkarna, Senior Advisor at Bounty Media, sums it up:
"SalesMind AI has significantly reduced the pain of manual lead tracking" [18].
The inbox also connects directly to built-in analytics, offering real-time insights into metrics like connection acceptance and reply rates. For example, users typically see a 40% acceptance rate and a 45% reply rate, all displayed in a centralized dashboard [17].
AI-Powered Lead Scoring for Better Prioritization
SalesMind AI uses advanced scoring to rank prospects based on their fit with your targeting criteria. It evaluates factors like job title, company size, and previous interactions to predict which leads are most likely to convert. This allows you to focus your efforts on high-value prospects, improving conversion rates, which generally range from 5% to 15% in B2B campaigns [19]. The results speak for themselves. Steven Huibers, COO at Policereports.ai, shares:
"I've used a couple of other tools for LinkedIn outbound, but this has gotten me 3x the results" [18].
By filtering out less promising leads, this system also helps reduce the cost per lead (CPL), ensuring your resources are spent wisely.
Real-Time KPI Dashboards
SalesMind AI’s real-time dashboards take performance tracking to another level. These dashboards provide live updates on metrics like response rates, CPL, and conversion ratios, allowing you to adapt your strategies as needed. Instead of waiting until the end of a campaign to analyze results, you can identify and address issues - like falling acceptance rates or rising CPL - as they happen [19]. Nick Heijman, CEO of HypotheekXperts, highlights the platform’s impact:
"The results were sometimes almost too good, connection rates and responses were way above what I expected" [18].
The dashboards turn raw data into actionable insights, helping you pinpoint which message formats, industries, or lead segments are delivering the best results. On average, users generate $100,000 in pipeline value per month using this tool [17].
Conclusion
Measuring the right LinkedIn automation KPIs takes B2B prospecting from a guessing game to a structured, data-driven process. By keeping an eye on metrics like connection acceptance rates, message response rates, lead conversion, cost per qualified lead, and time saved, you can turn prospecting into something scalable and systematic [19]. This data-driven approach helps you fine-tune your strategies over time.
Start by setting benchmarks in the first few weeks and use real-time data to tweak your methods. This cycle of measuring, learning, and adapting ensures your outreach remains effective, avoiding stagnation and keeping opportunities flowing. LinkedIn automation tools have come a long way, evolving from basic scheduling features to platforms that provide real-time performance insights, with dashboards that update frequently.
SalesMind AI builds on these advancements by combining tracking, scoring, and analytics into one streamlined platform. Its unified inbox and AI-driven lead scoring simplify prioritizing prospects, while its real-time dashboards help you spot trends that need immediate action.
Focusing on outcome-based KPIs instead of just activity metrics is what sets scalable teams apart. By identifying which message formats, industries, and lead segments yield the best results, you can zero in on the prospects that matter most. Automating the repetitive tasks transforms LinkedIn prospecting into a dependable revenue generator.
FAQs
What are the best ways to increase my LinkedIn connection acceptance rate?
To improve your LinkedIn connection acceptance rate, start by personalizing your connection requests. A short, thoughtful message that explains why you're reaching out and shows genuine interest can make a huge difference. Skip the cold, generic requests - they often feel spammy and are easy to ignore.
Timing matters too. Connection requests are more likely to get accepted within the first 24 hours, especially if the person you're reaching out to is active on LinkedIn. Tools like SalesMind AI can help you automate personalized outreach, allowing you to scale your efforts without losing that personal touch. Finally, keep an eye on key metrics like acceptance and response rates. These insights can help you fine-tune your strategy and get better results over time.
What affects the cost per qualified lead on LinkedIn?
Several elements can influence how much you pay per qualified lead on LinkedIn. First, lead quality is a major factor. Higher-quality leads often demand more precise targeting, which can drive up costs. Then there’s audience targeting - the more you narrow your audience to reach the right people, the more efficient your campaign becomes, potentially cutting down on wasteful spending.
Another important piece is campaign optimization. Testing and fine-tuning your ad copy, visuals, and call-to-action can significantly improve performance. On top of that, using AI tools for lead qualification can save time by automating parts of the process and ensuring you focus on leads with the highest likelihood of converting.
How does LinkedIn automation improve ROI and save time?
LinkedIn automation helps increase ROI and saves time by handling repetitive tasks such as outreach, lead qualification, and follow-ups. By automating these activities, businesses can dedicate more energy to tasks that matter most - like building meaningful relationships and closing deals. This shift allows for a smarter allocation of time and resources.
Tools like SalesMind AI take efficiency to the next level by automating tasks like personalized messaging and lead management. This enables teams to scale their prospecting efforts without adding more manual work. The result? Better-quality leads, more sales opportunities, and measurable growth. Automation has become a smart move for achieving LinkedIn outreach success.
 JG
JG