2026 Sales Funnel Benchmarks for LinkedIn
LinkedIn delivered a 113% ROAS in 2025, making it the top B2B ad channel. This report covers 2026 benchmarks across the full funnel: TOFU CTRs of 0.45-0.9%, MOFU CPLs of $120-250, and SQL conversion rates of 5-15%. Use these numbers to set realistic targets and spot where your pipeline is leaking.
LinkedIn delivered a 113% ROAS in 2025, making it the top B2B ad channel. This report covers 2026 benchmarks across the full funnel: TOFU CTRs of 0.45-0.9%, MOFU CPLs of $120-250, and SQL conversion rates of 5-15%. Use these numbers to set realistic targets and spot where your pipeline is leaking.
Top-of-Funnel (TOFU): CTRs range from 0.45%–0.9%, CPCs between $8–$15, and CPMs from $50–$90. Broad audiences perform better for awareness, while Thought Leader Ads and short videos excel in engagement.
Middle-of-Funnel (MOFU): CPLs average $120–$250, with LinkedIn Lead Gen Forms converting 2–3x higher than external landing pages. Document Ads are the most effective, lasting up to 11 weeks before fatigue.
Bottom-of-Funnel (BOFU): SQL costs range from $200–$450, with demo booking rates of 3%–6%. Retargeting CRM lists and using Document Ads improve conversion rates significantly.
Table of Contents
LinkedIn dominated B2B advertising in 2025, accounting for 39% of B2B ad budgets and delivering a 113% return on ad spend (ROAS) - outperforming competitors like Google and Meta. However, challenges persist, such as a 211-day customer journey and a 3+ month bottleneck in the MQL-to-SQL phase. To stay competitive, businesses must measure their performance against industry benchmarks and optimize their campaigns.
Key Insights:
- Top-of-Funnel (TOFU): CTRs range from 0.45%–0.9%, CPCs between $8–$15, and CPMs from $50–$90. Broad audiences perform better for awareness, while Thought Leader Ads and short videos excel in engagement.
- Middle-of-Funnel (MOFU): CPLs average $120–$250, with LinkedIn Lead Gen Forms converting 2–3x higher than external landing pages. Document Ads are the most effective, lasting up to 11 weeks before fatigue.
- Bottom-of-Funnel (BOFU): SQL costs range from $200–$450, with demo booking rates of 3%–6%. Retargeting CRM lists and using Document Ads improve conversion rates significantly.
Full Funnel Metrics:
- Lead-to-MQL: 31%
- MQL-to-SQL: 15%–21%
- SQL-to-Customer: 2%–5%
Optimizing LinkedIn campaigns requires balancing spend across TOFU, MOFU, and BOFU stages (60/25/15 split) and leveraging high-performing formats like Document Ads and Lead Gen Forms. Tools like SalesMind AI can further streamline outreach, lead scoring, and personalization to improve results.
 Sales Funnel Benchmarks: Complete Performance Metrics by Funnel Stage" style="max-width:100%; margin:1em auto; display:block;">
2025 LinkedIn Sales Funnel Benchmarks: Complete Performance Metrics by Funnel Stage
Benchmarking Your Sales Results from LinkedIn Ads
Top-of-Funnel Benchmarks for LinkedIn
Top-of-funnel strategies are all about building awareness and setting the stage for future retargeting. When it comes to LinkedIn, keeping an eye on your performance against 2025 benchmarks is key. On average, high-performing B2B accounts dedicate about 60% of their LinkedIn budget to awareness and demand generation efforts [4].
Key Metrics: CTR, CPC, and CPM
In 2025, LinkedIn's top-of-funnel campaigns saw click-through rates (CTR) ranging from 0.45% to 0.9%, cost-per-click (CPC) between $8 and $15, and cost-per-thousand impressions (CPM) falling between $50 and $90 [4]. If your CTR dips below 0.45%, it’s a signal to pause and reassess. As Justin Rowe from Impactable puts it:
"If TOFU engagement drops below 0.45% CTR, don't just throw more money at it. Stop, diagnose the messaging problem, and fix it before scaling again." [4]
Targeting senior-level prospects tends to cost more, with CPCs averaging $8.30 (converted from £6.40), compared to $5.70 (converted from £4.40) for junior employees [9]. Ad format also plays a role in performance. Single-image sponsored content led the pack with an average CTR of 0.56%, followed by video ads at 0.44%, document ads at 0.43%, and carousel ads at 0.40% [9]. Surprisingly, multi-image posts drove the highest engagement rates, hitting 6.60%, compared to 4.85% for traditional single images [9].
| Metric | Great | Good | Needs Work |
|---|---|---|---|
| CTR | > 0.60% | 0.40–0.60% | < 0.30% |
| CPC | < $5 | $5–$7 | > $8 |
| CPM | $25–$30 (Video) | $30–$50 (SaaS) | > $60 (Niche) |
These benchmarks help guide creative decisions to boost top-of-funnel results.
Best Creative Types for Top-of-Funnel
In 2025, the best-performing top-of-funnel creative formats didn’t look or feel like traditional ads. Content like POV videos, Thought Leader Ads, and founder-led posts stood out for their genuine, relatable tone [4]. Thought Leader Ads, in particular, held strong for up to 12 weeks before creative fatigue set in, compared to just 4 to 5 weeks for single-image ads [4].
This trend reflects a broader shift. As Katie Brown, Founder of Five Social UK, explained:
"Increasing your brand presence in 2025 on LinkedIn will come down to having a more authentic, human approach to using the platform. Sharing stories and experiences rather than faceless graphics." [9]
Video ads also played a major role in awareness campaigns. While their CTR averaged 0.44%, marketers used them to build retargeting pools based on view percentages, prioritizing reach and engagement over immediate conversions. Short videos - under 15 seconds - delivered the best results [9]. Creative fatigue varied by format: single-image ads peaked within 4 to 5 weeks, carousel ads lasted around 7 weeks, video ads performed well for 9 weeks, and document ads held strong for 11 weeks [4].
Audience Segment Performance Comparison
Audience segmentation had a major impact on top-of-funnel results in 2025. Broad audiences, typically ranging from 20,000 to over 100,000 people, achieved higher CTRs - around 0.5% for "good" performance and up to 0.8% at elite levels. In contrast, tighter, matched lists of 1,000 to 10,000 people generally delivered CTRs closer to 0.3% [10].
Industry performance also varied. Retail led with an average CTR of 0.8%, followed by Healthcare at 0.58%, and Finance & Insurance at 0.50% to 0.56%. SaaS and Software lagged slightly, averaging 0.40% to 0.45% [8][9]. Cost efficiency mirrored these trends. For example, Software & Applications saw median CPCs around $10.45 (converted from £8.04), while Finance & Insurance enjoyed a much lower CPC of approximately $3.37 (converted from £2.59) [9].
Here’s a quick look at benchmarks for audience segments:
| Audience Type | Typical Size | CTR (Good) | CPL (Good) |
|---|---|---|---|
| Broad | 20,000–100,000+ | 0.5% | ~$234 |
| Tight / Matched | 1,000–10,000 | 0.3% | ~$156 |
| Retargeting | 500–5,000 | 0.8% | ~$117 |
The "Audience Efficiency Ladder" highlights that cold, broad audiences - targeted based on job titles or seniority - are the least cost-efficient for lead generation, with CPLs ranging from $300 to over $600. Intent-based (ABM) audiences performed better, with CPLs between $250 and $400. Warm first-party audiences were the most efficient, with CPLs ranging from $120 to $250 [4]. Broad segments are best used to build familiarity and strengthen retargeting efforts, rather than to meet final CPL goals. As James Green from B2B Ads Assistant advises:
"Small, hyper-targeted lists can outperform huge broad audiences for pipeline and ROI. Don't chase volume - chase quality." [10]
Middle-of-Funnel Benchmarks for LinkedIn
Middle-of-funnel (MOFU) campaigns are all about nurturing warm leads - those who’ve already shown some level of interest in your brand - and guiding them closer to making a purchase. Instead of casting a wide net for new prospects, MOFU strategies focus on retargeting people who’ve engaged with your content in the past [4]. Let’s break down the numbers that matter most in these campaigns.
Key Metrics: CPL, Form Fill Rates, and CTR
For MOFU campaigns using LinkedIn Lead Gen Forms and Document Ads, here’s what the data shows:
- Cost-per-lead (CPL): Typically ranges between $120 and $250.
- Form fill rates: Fall between 8% and 18%. If your rate dips below 8%, it’s a clear sign that your offer or landing page needs work [4].
- Click-through rates (CTR): Average between 0.5% and 0.8%.
Native LinkedIn Lead Gen Forms consistently outperform external landing pages, converting 2 to 3 times higher by keeping users on the platform and cutting down on friction [8][13]. Cost-per-click for MOFU campaigns generally lands between $10 and $18, while CPMs range from $50 to $90 [4]. Industry specifics also play a role. For example, B2B SaaS companies targeting enterprise clients report CPLs between $150 and $300, whereas marketing agencies and business services see CPLs around $60 to $120 [13].
When it comes to converting leads into sales opportunities, LinkedIn shines with a 10% to 15% conversion rate, much higher than Facebook’s 2% to 5% [13]. The journey from MQL (marketing-qualified lead) to SQL (sales-qualified lead) takes about 107 days on average, though this timeline shifts by quarter. Q1 sees the fastest conversion times at 24 days, while Q4 stretches to 68 days [11]. Interestingly, Q2 stands out as the most cost-efficient quarter, generating 30% of MQLs with just 18% of the annual budget [11].
Top Creative Types for Lead Nurturing
Getting the most out of these metrics depends heavily on choosing the right creative formats. Document Ads are the standout choice for MOFU campaigns. Why? They let users interact with your content directly on LinkedIn, eliminating the need to leave the platform. On average, prospects spend 3 to 5 minutes engaging with Document Ads, which boast a lead form completion rate of 22.73% - dramatically higher than video ads at just 2.26% [4][12].
While Document Ads come with higher CPMs, they deliver lower CPLs. For instance:
- Document Ads: Average CPL of $255.81.
- Single-image ads: CPL of $317.36.
- Video ads: CPL of $724.84 [12].
As Alex Gluz, Founder of T.A. Monroe, puts it:
"Document ads climbed from 4% to 11% of total spend because they trade CPM premiums for the lowest CPL." [12]
These ads also have staying power, lasting around 11 weeks before creative fatigue sets in - far longer than the 4 to 5 weeks typical for single-image ads [4]. They’re particularly effective for promoting resources like whitepapers, playbooks, and frameworks that educate and build trust. A winning strategy? Retarget demo page visitors within a 30 to 90-day window using Document Ads paired with Lead Gen Forms. This approach has shown to deliver a 2.5 times higher demo-to-close rate compared to standard retargeting methods [4].
Channel Performance Comparison
How does LinkedIn stack up against other platforms for middle-of-funnel lead generation? It’s a mixed bag. While LinkedIn tends to have higher costs, its lead quality and influence stand out. Here’s a quick comparison:
| Channel | MQL to SQL Conversion Rate | Avg. CPL |
|---|---|---|
| LinkedIn Ads | 2% to 4% | $150 to $250 |
| Content Syndication | 6% to 8% | $65 to $95 |
| Google Ads | 1% to 3% | $100 to $175 |
| Events/Trade Shows | 7% to 15% | $250 to $500 |
LinkedIn also influenced 36% of SQLs in the B2B sales process, outperforming both Google and Meta [1]. Implementing LinkedIn’s Conversions API (CAPI) further boosted results, lowering cost-per-acquisition by 20% and increasing attributed conversions by 31% [1].
To maximize MOFU performance, experts recommend allocating 25% of your total LinkedIn budget to this stage, following the 60/25/15 rule that divides spending across top, middle, and bottom-of-funnel efforts [4].
Bottom-of-Funnel Benchmarks for LinkedIn
Bottom-of-funnel (BOFU) campaigns are all about turning engaged prospects into actual sales opportunities. At this point, you’re targeting people who are already familiar with your brand and guiding them toward actions like booking a demo, requesting a quote, or connecting with sales. Just like earlier funnel stages, precise targeting is critical here to seal the deal. The metrics at this stage reveal if your targeting, messaging, and proof points are convincing enough to drive conversions.
Key Metrics: SQL Costs, Demo Booking Rates, and CTR
Building on middle-of-funnel (MOFU) insights, BOFU metrics measure how well your conversion strategies are working. For starters, the cost per sales-qualified lead (SQL) generally falls between $200 and $450, especially when you’re retargeting CRM lists or first-party audiences [4]. Retargeted audiences deliver demo booking rates of 3% to 6% and click-through rates (CTRs) ranging from 0.7% to 1.2% [4]. Cost-per-click (CPC) at this stage typically ranges between $12 and $22 [4].
Once SQLs are generated, they convert into opportunities at a rate of 20% to 30% [3].
Best Creative Types for Conversions
At the bottom of the funnel, your messaging should focus on proof points. Prospects at this stage are looking for specifics - ROI data, competitive comparisons, customer testimonials, and even pricing previews [4]. Document Ads work particularly well here, as they encourage more in-depth engagement. For example, retargeting demo page visitors using a combination of Document Ads and Lead Gen Forms can result in a demo-to-close rate that’s 2.5 times higher than traditional retargeting methods [4].
Justin Rowe, Founder of Impactable, highlights the value of Document Ads:
"Document engagement is emerging as a powerful warm signal for BOFU sequencing. When someone downloads or views a document ad, they're spending 3-5 minutes with your content" [4].
Case studies featuring specific ROI data and testimonials tailored to an industry tend to outperform generic messaging by 15% to 20% across all key metrics [2]. Aligning your creative with the prospect’s stage is crucial. For instance, someone visiting your pricing page may need a different push compared to someone who last engaged with your brand 90 days ago [4]. These tailored strategies not only improve conversion rates but also impact cost efficiency.
CPL by Audience Warmth
The cost-per-lead (CPL) at the BOFU stage depends heavily on how "warm" your audience is. Warmer audiences - like CRM lists or demo page visitors - are far more cost-efficient than broader, colder audiences. Here’s a breakdown:
| Audience Type | Warmth Level | CPL Benchmark |
|---|---|---|
| Warm 1st-Party (BOFU) | CRM lists, demo visitors | $75 - $150 [4] |
| Warm 1st-Party (MOFU) | Site visitors, content engagers | $120 - $250 [4] |
| ABM (Intent/Fit) | ICP + intent signals | $250 - $400 [4] |
| Cold Native Targeting | Broad title/seniority targeting | $300 - $600+ [4] |
The pattern is clear: the more engaged and familiar an audience is with your brand, the lower your CPL. That’s why many high-performing accounts dedicate 15% of their total LinkedIn budget to BOFU campaigns, following the 60/25/15 rule for funnel allocation [4].
sbb-itb-817c6a5
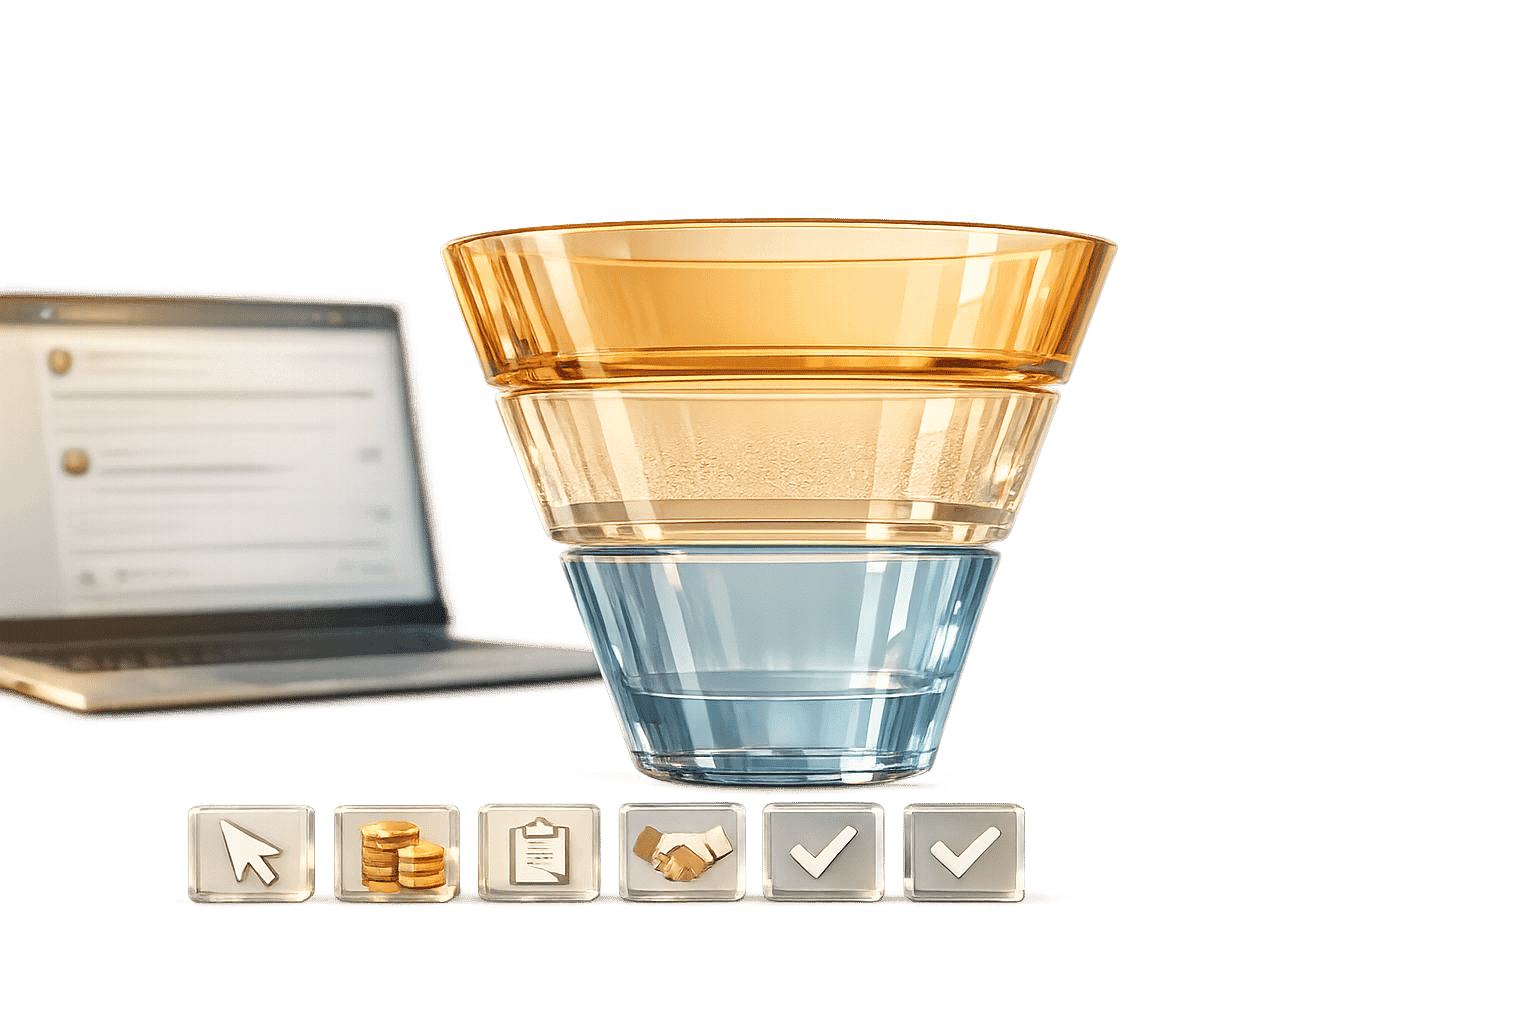
Full Funnel Metrics and Conversion Rates
Analyzing the entire funnel provides a clear picture of where potential customers drop off and where opportunities for growth lie. While it's important to measure each stage individually, examining the complete journey - from the first interaction to a closed deal - helps prioritize areas that could deliver the greatest impact. For example, even small improvements in mid-funnel performance can increase revenue by 12% to 18% [5]. This makes tracking performance across all stages a necessity.
Conversion Rates by Stage
Conversion rates vary significantly across funnel stages and business types. For instance, visitor-to-lead conversion rates stand at 1.4% for SMB/mid-market businesses but drop to 0.7% for enterprises [5]. Other key benchmarks include:
- Lead-to-MQL: Averages 31% across industries, rising to 39% for B2B SaaS companies [6].
- MQL-to-SQL: Ranges between 15% and 21% [5].
- SQL-to-opportunity: Converts at 20% to 30% [3].
- Lead-to-customer: Falls within 2% to 5% [5].
The most significant drop-off occurs during the MQL-to-SQL stage, where much of the revenue potential is lost. This stage often represents the biggest challenge for many organizations.
| Funnel Stage | Average Benchmark | Top Performer Benchmark |
|---|---|---|
| Visitor to Lead | 1.4% (SMB/Mid-Market) [5] | N/A |
| Lead to MQL | 31% (Cross-Industry) [6] | 39% (B2B SaaS) [6] |
| MQL to SQL | 15%-21% [5] | 40% [3] |
| SQL to Opportunity | 20%-30% [3] | 59% [3] |
| Lead to Customer | 2%-5% [5] | N/A |
Pinpointing where these drop-offs occur allows teams to track pipeline velocity more effectively, which is key to driving revenue growth.
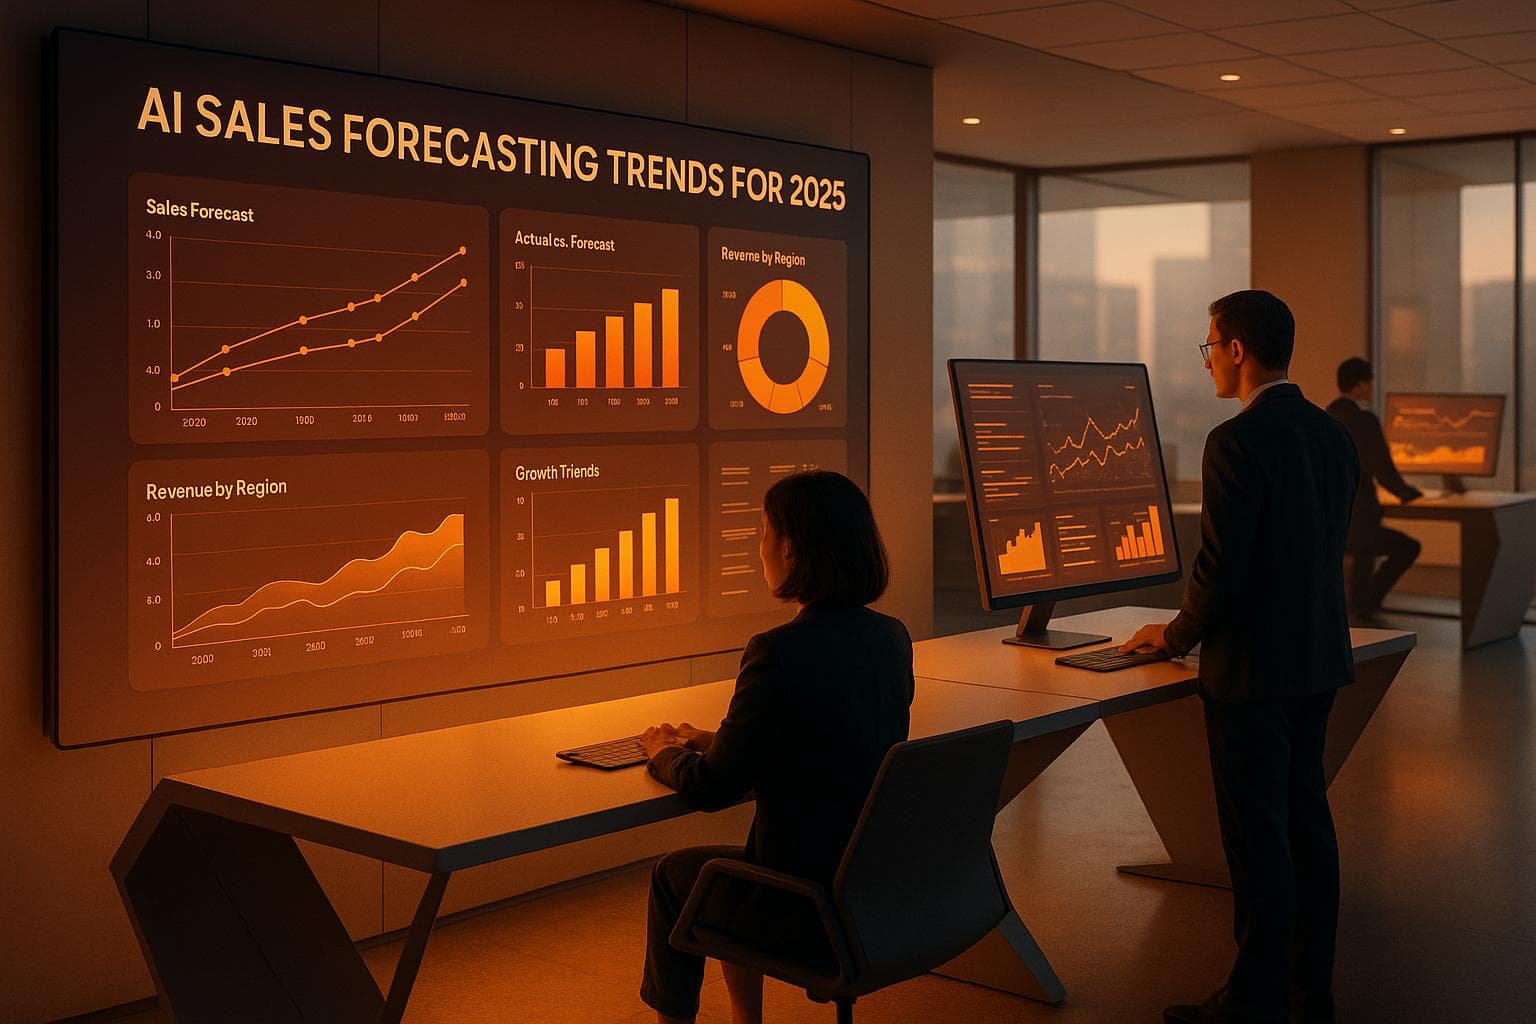
Pipeline Velocity and Win Rate Data
Pipeline velocity is a crucial metric for understanding revenue potential. It’s calculated using this formula:
(Opportunities × Deal Value × Win Rate) ÷ Sales Cycle Length [5].
Companies that monitor pipeline velocity weekly report revenue growth of 34%, compared to just 11% for those tracking it less frequently [5]. For B2B SaaS companies, typical win rates hover between 20% and 30% [5]. However, timing plays a critical role: deals closed within 50 days achieve a much higher win rate of 47%, compared to just 20% for deals that take longer [14].
The median sales cycle length is 84 days, but the optimal window - where deal value and speed align - is between 46 and 75 days [5].
These metrics, along with earlier benchmarks, provide a complete view of the funnel. They help identify where to focus efforts to optimize every stage of your LinkedIn strategy and improve overall performance.
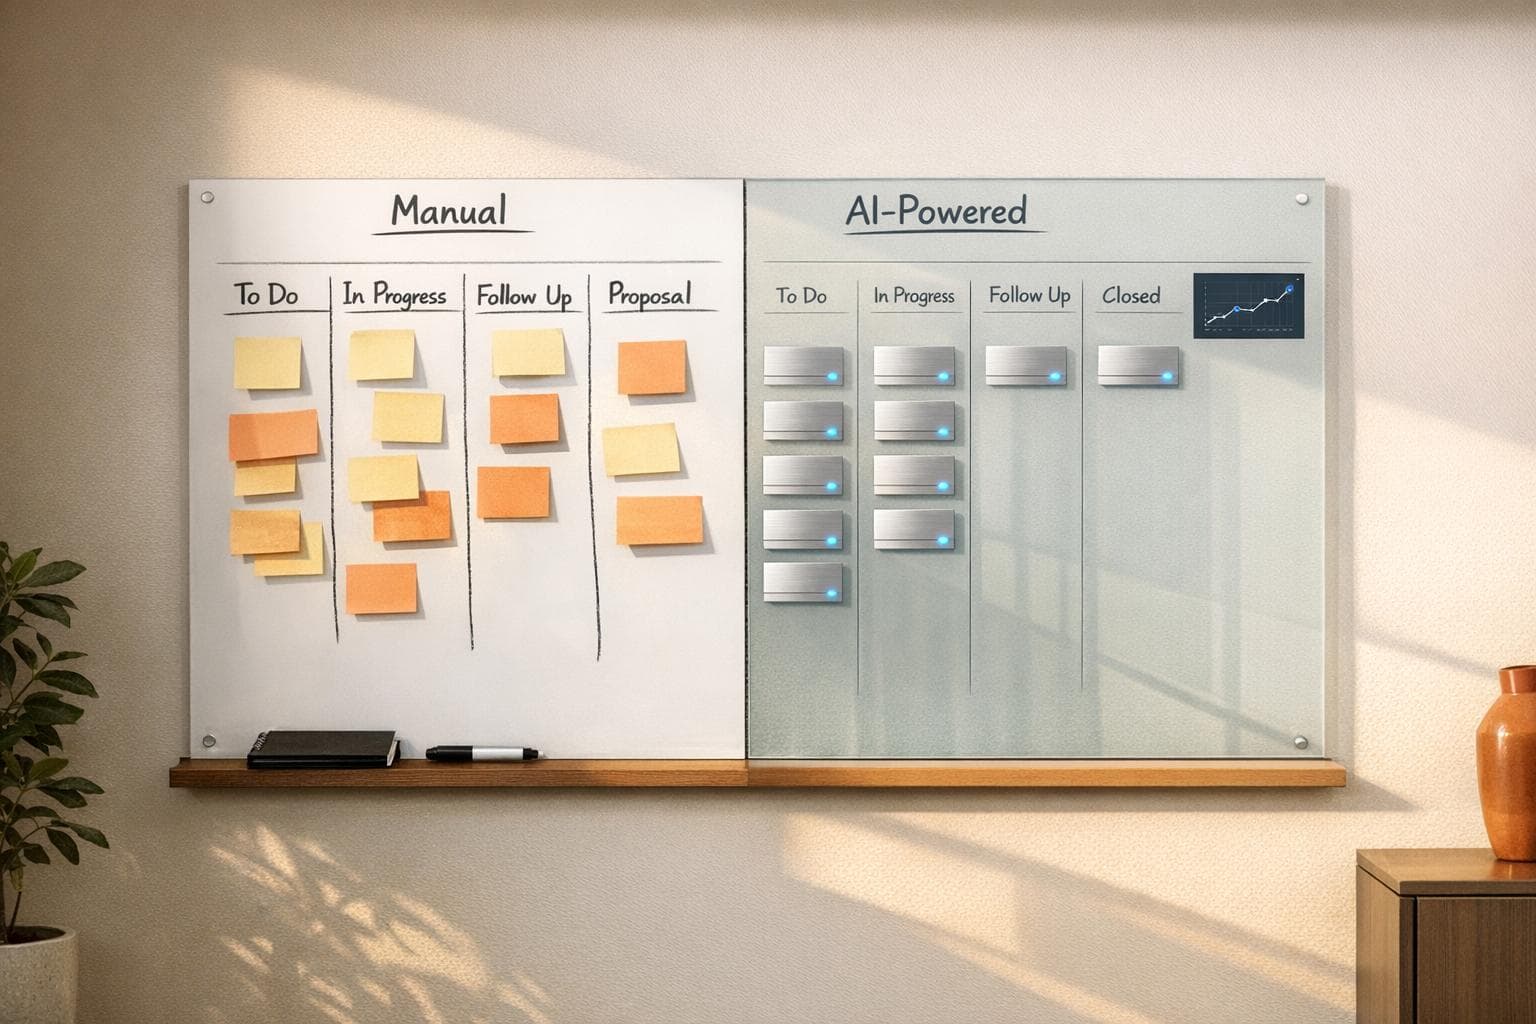
How SalesMind AI Improves LinkedIn Funnel Performance
Understanding benchmarks is one piece of the puzzle, but turning that understanding into action takes the right tools. SalesMind AI’s automation platform tackles the challenges at every stage of the LinkedIn sales funnel - from outreach to conversions. By blending AI-powered personalization with scalable automation, it helps businesses hit or even surpass performance targets.
Expanding Top-of-Funnel Reach with Automation
Manual outreach can only go so far. Automation, on the other hand, opens the door to scaling efforts. SalesMind AI allows teams to go beyond LinkedIn’s daily connection limits by managing outreach across multiple verified accounts. This approach not only splits target markets but also boosts outreach volume without violating platform rules [15]. It’s a game-changer for top-of-funnel performance, helping teams meet industry standards.
Personalization is key here. A short, tailored connection message can raise response rates from 5.44% to 9.36% [7]. SalesMind AI takes it a step further, with company-specific tools that push initial reply rates to 4.19%, compared to the average of 2.60% [7]. Automated follow-up sequences also make a difference: five nurturing actions yield a 5.26% reply rate, far outperforming the 1.07% seen with a single action [7].
Once outreach is scaled up, the next hurdle is qualifying those leads.
Streamlining Middle-of-Funnel Lead Qualification
The shift from MQL (Marketing Qualified Lead) to SQL (Sales Qualified Lead) is often a sticking point, with conversion rates hovering between 15% and 21% [5]. SalesMind AI tackles this issue with advanced lead scoring. By analyzing engagement and behavioral patterns, it prioritizes high-intent prospects, boosting conversion rates. Even a modest 5% improvement at this stage can increase total revenue by as much as 18% [5].
Another standout feature is the unified inbox, which merges conversations from multiple LinkedIn accounts. This ensures that no potential lead slips through the cracks. Automated, tailored messages keep things efficient while maintaining a personal touch, supporting healthy form fill rates [4].
With lead qualification optimized, the focus shifts to sealing the deal.
Driving Bottom-of-Funnel Conversions with Personalization
Closing deals at the BOFU (Bottom of Funnel) stage requires more than just inserting a prospect’s name into a message. It demands thoughtful personalization - like referencing recent company news, shared values, or industry trends [15]. This attention to detail builds trust and credibility, key ingredients for turning SQLs into booked demos.
SalesMind AI also integrates real-time lead tracking and CRM tools, giving sales teams the insights they need for effective follow-ups. Automation continues to play a role here, scaling outreach without losing relevance. This balance is especially important for managing SQL costs and improving demo booking rates.
Conclusion
LinkedIn continues to lead the way in B2B advertising, commanding 39% of ad budgets and delivering an impressive 113% return on ad spend (ROAS) [1]. Achieving success on this platform hinges on understanding every stage of the funnel, from connection rates to the cost of turning leads into sales-qualified leads (SQLs).
However, extended sales cycles and delays in moving from marketing-qualified leads (MQLs) to SQLs present ongoing challenges [1]. The importance of speed can't be overstated: deals closed within 50 days boast a 47% win rate, compared to just 20% for those taking longer [16]. Keeping the sales process moving quickly remains a critical advantage.
AI tools are reshaping the game. For example, AI-generated first messages see a reply rate of 4.19%, significantly higher than the 2.60% achieved with standard outreach methods [7]. Solutions like SalesMind AI, with its advanced lead scoring and unified inbox, help teams address qualification hurdles and convert more MQLs into SQLs.
Personalization is another key differentiator for top performers. Industries like technology and SaaS enjoy reply rates of 30% to 40% when personalization is prioritized, while less tailored approaches in other sectors see reply rates drop to just 10% to 20% [15]. Video messages can increase reply rates by 20% [15], and customized emails have been shown to double response rates [16]. While automation helps expand outreach, it’s personalization that drives meaningful engagement and results.
FAQs
How can businesses speed up the 211-day customer journey on LinkedIn?
To cut down the lengthy 211-day customer journey on LinkedIn, businesses can tap into AI-powered tools and smarter outreach methods. By automating tasks like personalized messaging, timely follow-ups, and lead qualification, companies can connect with prospects more efficiently and eliminate unnecessary delays in the sales process. These AI-driven tools ensure interactions are both timely and relevant, helping to keep leads moving smoothly through the sales funnel.
Another game-changer is data-driven lead prioritization, which allows sales teams to focus on high-quality prospects earlier in the process. For instance, tools like SalesMind AI simplify outreach by scoring leads and automating follow-up sequences. This combination of automation and tailored engagement helps maintain momentum and speeds up deal closures on LinkedIn.
What are the most effective ways to improve MQL-to-SQL conversion rates?
To improve MQL-to-SQL conversion rates, start by leveraging AI-driven lead scoring and automation. These tools help you zero in on high-quality leads - those most likely to convert - making your process more efficient and results-driven. Timing is also key. Reaching out to leads within the first hour can boost your conversion rates by over 50%. It’s all about striking while the iron is hot.
Another critical factor is ensuring sales and marketing alignment. When both teams share goals and KPIs, communication improves, and the handoff from MQL to SQL becomes seamless. This collaboration minimizes friction and keeps everyone focused on the same objectives.
Finally, don’t underestimate the power of personalization. Tailor your approach at every interaction and pay close attention to key buying signals. This builds trust and keeps prospects engaged. By combining these techniques, some industry leaders have achieved conversion rates as high as 40%.
How can SalesMind AI improve LinkedIn sales funnel performance?
SalesMind AI transforms LinkedIn sales funnels by combining automation with AI-driven personalization to make outreach more efficient and engaging. It handles tasks like crafting tailored messages, qualifying leads, and managing follow-ups, allowing businesses to scale their efforts without losing that personal touch. This approach ensures outreach stays consistent, timely, and relevant - perfectly aligned with the growing trends of higher acceptance and response rates expected by 2025.
Some standout features include an AI-powered unified inbox and advanced lead scoring, which make managing leads more straightforward. These tools help sales teams focus on top-quality prospects, boosting their chances of conversion. Plus, with seamless LinkedIn integration, SalesMind AI uses real-time analytics and behavioral triggers to fine-tune campaigns on the fly, ensuring maximum ROI. If you're aiming to build a scalable, data-focused LinkedIn funnel, this tool is a game-changer.