How to A/B Test LinkedIn Messages
A step-by-step guide to A/B testing LinkedIn outreach: set clear goals, test one variable, track reply and acceptance rates, and scale winning messages.
A step-by-step guide to A/B testing LinkedIn outreach: set clear goals, test one variable, track reply and acceptance rates, and scale winning messages.
Set clear goals: Define what you want to improve, like reply rates or meeting bookings. Use specific metrics (e.g., "Increase reply rate from 8% to 15% in 30 days").
Test one variable at a time: Focus on elements like tone, length, or personalization to isolate what drives better results.
Segment your audience: Split your prospect list into equal, randomized groups to ensure fair testing.
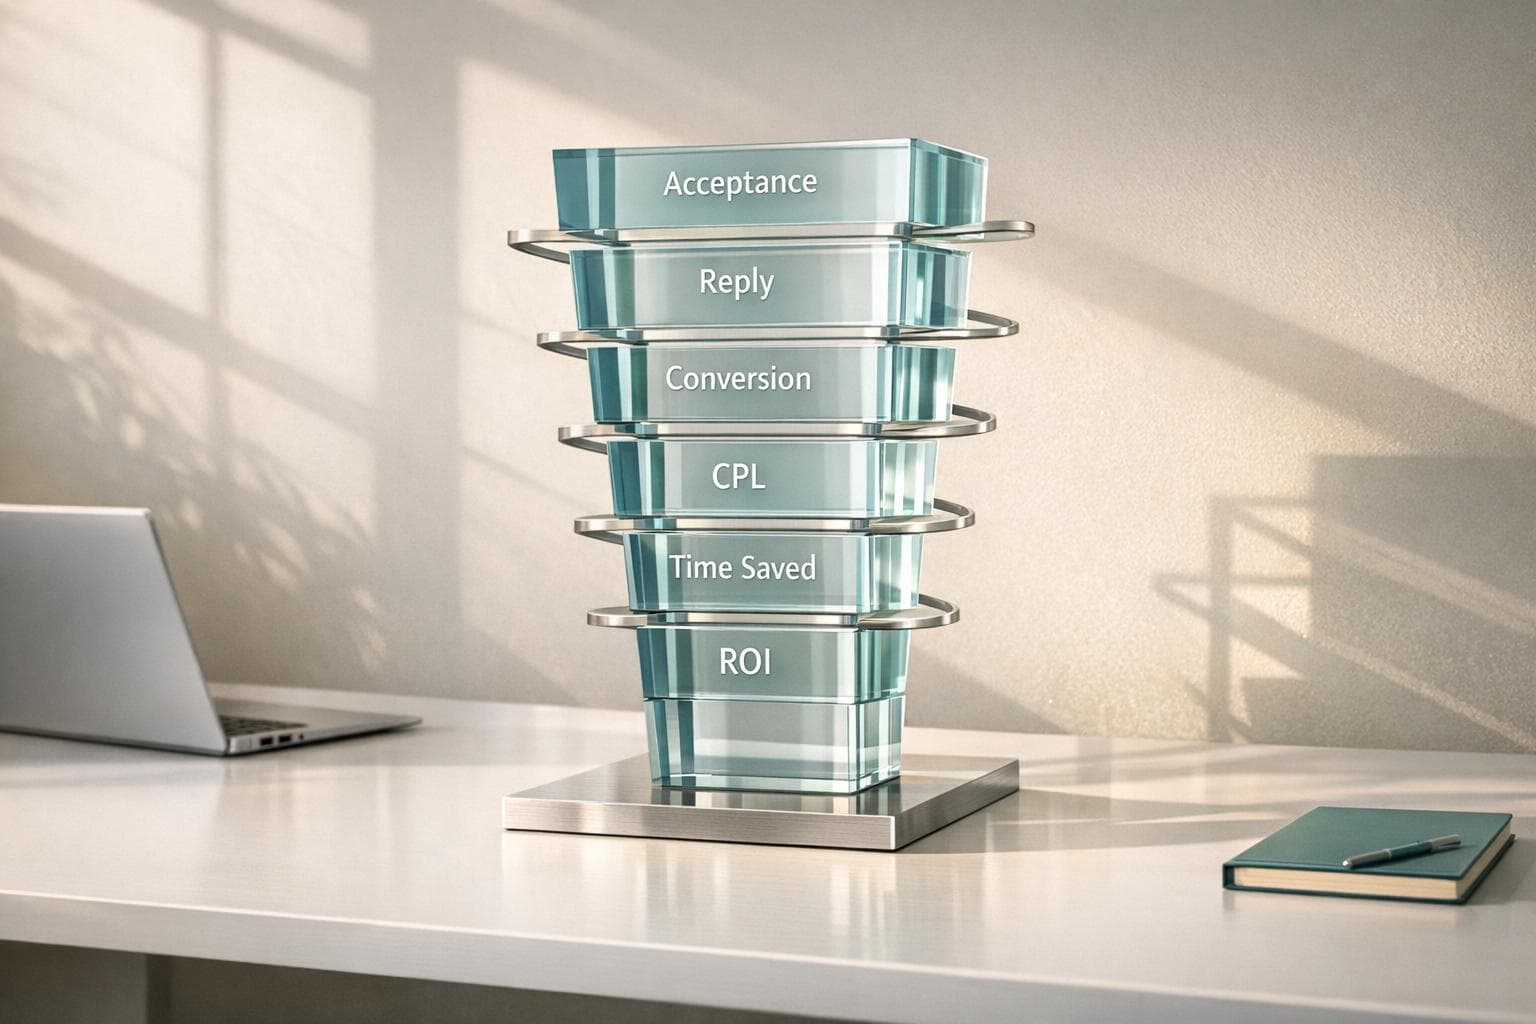
Track metrics: Key performance indicators include connection acceptance rates, reply rates, positive responses, and meetings booked.
Table of Contents
A/B testing LinkedIn messages helps you figure out which outreach approach works best by comparing two message versions. For example, you might test a casual message (Version A) against a formal one (Version B) to see which gets more replies, connection acceptances, or meetings. Here’s the process in a nutshell:
- Set clear goals: Define what you want to improve, like reply rates or meeting bookings. Use specific metrics (e.g., "Increase reply rate from 8% to 15% in 30 days").
- Test one variable at a time: Focus on elements like tone, length, or personalization to isolate what drives better results.
- Segment your audience: Split your prospect list into equal, randomized groups to ensure fair testing.
- Track metrics: Key performance indicators include connection acceptance rates, reply rates, positive responses, and meetings booked.
- Analyze results: Identify the winning message and scale it across larger campaigns.
Define Your Testing Goals and Metrics
Set Clear Objectives
Before diving into crafting message variants, take a moment to define exactly what you aim to achieve. Vague goals won't cut it - be specific about your desired outcomes and how they connect to your business objectives.
Start by reviewing your past outreach efforts, such as the last 50–100 attempts. Calculate key metrics like your connection acceptance rate and reply rate. For instance, if 25% of your connection requests are accepted and 8% of your messages get replies, these numbers become your starting point.
Now, set a SMART goal - something measurable and time-bound. For example: "Boost reply rate on initial messages from 8% to 15% within 30 days." This approach eliminates guesswork, replacing it with clear targets that keep you focused.
Zero in on the metric that needs the most attention. If prospects aren’t accepting your connection requests, prioritize improving the acceptance rate. After all, no one can respond to a message they never see. Once your acceptance rate improves, shift your focus to reply rates. If you’re getting replies but no meaningful outcomes, your next step might be targeting metrics like meeting-booked rates or qualified response rates.
Here are a few examples of well-defined objectives for US-based teams:
- "Increase connection acceptance among US VPs of Operations in logistics from 22% to 32% within 14 days." This targets a specific audience, includes a measurable baseline and goal, and sets a clear timeframe.
- "Double the number of intro calls booked from LinkedIn messages for $25,000 average deals, going from 3 to 6 meetings per 100 prospects this quarter." This ties outreach directly to revenue goals.
- "Raise qualified candidate responses for senior software engineer roles in the US from 10% to 18% within 21 days." This objective focuses on attracting high-quality candidates, not just increasing reply volume.
- "Grow pipeline per 100 prospects messaged from $15,000 to $25,000 over the next month." This shifts attention to revenue impact, making it a priority for sales teams.
Each of these examples includes the audience, baseline, target, timeframe, and a connection to measurable business results. When your objectives are this clear, your team knows exactly what success looks like.
With your goals set, the next step is identifying the metrics that will track your progress.
Select Key Performance Metrics
Once your objectives are in place, pinpoint the metrics that will measure your success. These should directly align with your outreach goals. For LinkedIn message testing, several key metrics can reveal how effective your efforts are.
- Connection acceptance rate: This measures how many people accept your connection requests. For example, if you send 100 requests and 30 are accepted, your acceptance rate is 30%. It’s a solid indicator of how compelling your profile and initial outreach are.
- Reply rate: This tracks the percentage of recipients who respond to your messages. Divide the number of replies by the total messages sent. It shows whether your messaging sparks enough interest to start a conversation.
- Positive response rate: While reply rate measures quantity, this metric focuses on quality. It counts responses that show genuine interest, like "Let’s schedule a call" or "Tell me more." This helps you avoid optimizing for replies that don’t lead anywhere.
- Meeting or demo booked rate: This ties directly to your sales process. Calculate it by dividing the number of meetings scheduled by the number of new conversations started. For most sales teams, this is the ultimate metric, as it connects outreach to pipeline and revenue.
- Click-through rate (CTR): If your message includes a link - like a case study or booking page - CTR measures how often recipients click it. Divide the number of clicks by the messages containing the link. This shows how compelling your call-to-action is.
Don’t forget to track lead quality. Ensure that replies match your ideal customer profile (ICP) and result in qualified leads. Metrics like the percentage of replies that fit your ICP, the share of conversations turning into MQLs or SQLs, and how many LinkedIn-sourced leads progress through your CRM stages can help you avoid focusing on vanity metrics that don’t drive real results.
Stick to one primary metric per test to avoid conflicting outcomes. For instance, if you’re testing connection requests, focus solely on acceptance rate. Once that improves, run separate tests on message content to boost reply rates among accepted connections.
Tracking these metrics doesn’t have to be overwhelming. LinkedIn Sales Navigator provides tools to monitor sent invitations, acceptance rates, and message history. You can log this data in a simple spreadsheet, tracking details like contact date, segment, message variant, acceptance, reply, meeting booked, and opportunity value in dollars. Use filters and pivot tables to calculate metrics automatically.
For larger campaigns, consider outreach platforms that streamline data collection. Tools like SalesMind AI can automate LinkedIn workflows, recording every interaction and attributing meetings or opportunities back to specific messages. This reduces manual effort and ensures accuracy, making it easier to run multiple tests and track nuanced metrics like lead quality across hundreds - or even thousands - of prospects.
Before you start testing, document everything. Create a test plan that outlines your hypothesis, primary metric, baseline, target, and test duration. This plan serves as your roadmap, helping you compare results over time and refine your approach. By keeping a record of what works and what doesn’t, you’ll build a repeatable playbook for LinkedIn outreach that evolves with your business needs.
Create and Test Your Hypotheses
Develop a Testable Hypothesis
A solid hypothesis is the foundation of any A/B test. The trick? Focus on one variable at a time and predict how tweaking it will influence a specific metric. Testing too many changes simultaneously muddies the waters - you won’t know which adjustment made the difference. That’s why single-variable testing is essential.
Start by revisiting your primary metric. For instance, if your InMail reply rate is currently 9%, that’s your baseline. Now, think about one change that could improve it. Maybe you believe shorter messages resonate better with time-strapped executives, or that referencing a prospect’s recent LinkedIn activity will outperform a generic introduction.
Frame your hypothesis as a clear statement. It should include the variable you’re testing, your audience, the metric you’re tracking, and the expected outcome. Here’s a straightforward formula: define the variable, note your baseline, identify your target audience, and predict the result - ideally with a target percentage.
For example:
"Among U.S. SaaS CROs, shorter messages (under 80 words) will generate a higher reply rate than longer messages (over 160 words)."
This hypothesis is precise: it specifies the audience (U.S. SaaS CROs), the variable (message length), and the metric (reply rate). You could refine it further by setting a goal, like increasing the reply rate from 9% to 13%[1].
Here are a few more hypothesis examples:
- Personalization hypothesis: "For HR managers, InMails that mention a recent LinkedIn post will increase reply rate from 8% to 14% compared to non-personalized intros."[1]
- Tone hypothesis: "For C-suite executives, concise messages under 75 words will achieve a higher reply rate than detailed 200-word messages, given the same offer."[1]
Each hypothesis should connect directly to your business goals. For example, if your objective is to book more meetings, focus on metrics like positive responses or scheduled appointments.
When documenting your test, create two versions: Version A (control) - your current or best-performing message - and Version B (variant), which is identical except for the variable you’re testing. For instance, if you’re testing opening lines, keep everything else the same.
Here’s an example of testing a personalized versus generic opening line:
- Version A (control): "Hi Sarah, I noticed we're both in the HR tech space. I'd love to connect."
- Version B (variant): "Hi Sarah, I liked your recent post on employee retention, especially your point on onboarding. I'd love to connect."[1]
The only difference is the opening line. If Version B gets more replies, you can attribute the improvement to the personalized touch.
Keep detailed records of both versions with descriptive names (e.g., "Q1_TechFounders_PersonalizedHook_A" and "Q1_TechFounders_PersonalizedHook_B"). Include your hypothesis, variable, audience, test dates, sample sizes, and results. This documentation serves as your playbook, preventing repeated tests and building on what’s effective.
Once your hypothesis and message variants are ready, dive into testing specific elements.
Examples of Variables to Test
With your hypothesis in place, focus on individual message elements that could influence your metrics. Test these systematically to pinpoint what works.
Message Content
- Opening line: A generic greeting like "We're both in X industry" might be overlooked, while a more specific opener like "I enjoyed your recent post about..." could grab attention[1].
- Personalization depth: Basic personalization (using the recipient’s name and role) is scalable, but deeper personalization (mentioning a specific post, company initiative, or mutual connection) often feels more authentic. This extra effort may pay off for high-value prospects[1].
- Value proposition: Experiment with different angles. Do your prospects care more about cost savings, revenue growth, or risk reduction? Test specifics like "increased pipeline by 32%" against broader benefits to see what resonates.
Message Structure and Style
- Length: Short messages (50–80 words) respect your recipient’s time, while longer ones (150–200+ words) provide more context. Many B2B audiences prefer concise outreach, but preferences can vary by industry and seniority[1][2].
- Tone: Adjust your tone to match your audience. A formal tone may work for traditional industries, while a conversational tone might appeal to startups or tech companies. For example:
- Formal: "I would appreciate the opportunity to discuss how our solution supports organizations like yours."
- Conversational: "Got a quick idea that might help [company] get more qualified demos - worth a quick chat?"[1]
- Call-to-Action (CTA): Test different CTAs. Compare direct asks like "Are you free for a 15-minute call next Tuesday at 2:00 PM?" with softer ones like "Would you be open to learning more about how we’ve helped similar companies?"[1]
Format and Add-ons
- Test whether including links or media impacts engagement. For example, does adding a case study or booking link boost responses, or does it come across as too aggressive? Compare plain text messages with those featuring short personalized videos or voice notes[1].
Follow-Up Sequences
- Experiment with your follow-up strategy. Test variables like the number of follow-up messages and the timing between them. Small changes here can significantly improve your outreach cadence.
For larger campaigns, tools like SalesMind AI can simplify this process. Its AI-driven messaging and lead-scoring features let you quickly create and test multiple variants, then automatically deploy the best-performing version across your U.S. prospect lists. A unified inbox tracks interactions, helping you link meetings and opportunities to specific message versions.
Here’s a quick reference table for testing ideas:
| Variable Type | Example A (Control) | Example B (Variant) | Hypothesis Focus |
|---|---|---|---|
| Opening line | "Hi [Name], I noticed we're both in the [industry] space." | "Hi [Name], I really enjoyed your recent post about [topic]." | Personalized opener will increase replies. |
| Tone | "I'd like to schedule a brief introductory call." | "Got a quick idea that might help [company] - worth a quick chat?" | Conversational tone will raise reply rate. |
| CTA style | "Are you free for a 15-minute call next Tuesday?" | "Would you be open to learning more about our approach?" | Softer CTA will boost responses. |
| Message length | 2–3 sentence connection note | 6–7 sentence message with more context. | Shorter message will increase acceptance. |
| Media/link inclusion | Plain text message | Message with a link to a case study or video. | Including a link will increase clicks. |
Start by testing variables that align with your goals. If your challenge is low connection acceptance, focus on opening lines and personalization. If replies aren’t converting to meetings, refine your CTAs and value propositions. Use insights from each test to prioritize your next steps.
Set Up and Run Your A/B Test
Once you've nailed down your hypothesis and created your message variations, it’s time to put your A/B test into action. To get reliable results, you’ll need a solid plan to ensure that any performance differences can be traced directly to your test variable.
Segment Your Audience
Careful audience segmentation is a must. Start by creating a prospect list that’s as uniform as possible. For instance, if your target group is U.S.-based VPs of Marketing at SaaS companies with 50–500 employees, make sure every prospect fits this profile. Mixing vastly different personas - like founders and junior employees - can skew your results since these groups may naturally respond differently.
Once your list is ready, split it into two equal groups at random. Randomization is key to avoiding bias that might arise from factors like company size, location, or when a prospect was added to your CRM. For example, if you’re testing 200 prospects, aim for 100 in each group. Ideally, each group should have a similar breakdown of job titles, industries, seniority levels, and company sizes.
Plan to run your test for about 1–2 weeks, depending on your sending volume. This timeframe ensures both groups experience similar external factors. Cutting the test short - even if one version seems to perform better - can lead to misleading conclusions.
Once your audience is split, your next priority is to eliminate any outside influences.
Control for Variables
To get clear, actionable results, the only difference between your test groups should be the variable you’re testing. If there are multiple changes, you won’t know what caused the difference in performance.
Here’s how to keep things consistent:
- Use identical target personas, sender profiles, follow-up schedules, and timing for both groups.
- Launch both campaigns at the same time to ensure similar conditions.
- Keep the same offer or call-to-action across both messages. For example, asking for a 15-minute call in one message and a 30-minute demo in the other introduces too many variables.
- Avoid running tests during times that could impact results, like major holidays, industry events, or end-of-quarter crunch periods.
Testing multiple variables at once is a common mistake. If you change both the opening line and the call-to-action, you won’t know which tweak made the difference. Stick to one variable per test. Once you identify a winner, use it as your new baseline and test the next variable.
Use the Right Tools
With your test set up and variables controlled, automation tools can save you time and reduce errors. Manually running LinkedIn A/B tests can be tedious and prone to mistakes. Automation platforms simplify the process by sending your message variants to randomized groups and ensuring consistent delivery.
SalesMind AI is an excellent tool for LinkedIn A/B testing at scale. It lets you upload or sync lead lists from your CRM, segment prospects by persona, and set up parallel A/B sequences. The platform tracks key metrics - like reply rates, positive responses, and meetings booked - using an AI-powered unified inbox.
One standout feature of SalesMind AI is its advanced lead scoring. This goes beyond just tracking reply rates. For example, if one message variant has a 35% reply rate but attracts fewer senior decision-makers compared to another variant with a 20% reply rate, the lead scoring feature can help you decide which message is more effective based on the quality of responses.
Automation ensures both message variants are sent fairly and consistently. You can define your test parameters - such as sample size, duration, and primary key performance indicator (KPI) - and let the platform handle the rest. Its unified inbox also makes it easy to track all interactions in one place.
During the test, focus on the right metrics. Your primary KPI - whether it’s connection acceptance rate, reply rate, click-through rate, or meetings booked - should align with your hypothesis. Secondary metrics can provide useful context but shouldn’t drive your main decisions.
Finally, document everything. Keep records of prospect assignments, send times, and responses. This creates a playbook for future tests and helps you spot trends, like whether certain industries or seniority levels respond better to specific messaging styles.
sbb-itb-817c6a5
Analyze and Scale Your Results
Once your testing period wraps up, it’s time to dive into the data. The goal? Pinpoint the best-performing message, figure out why it worked, and use those insights to fine-tune your broader LinkedIn outreach strategy.
Evaluate Test Performance
Start by focusing on your primary metric - the one you set at the beginning of the test. If your goal was to boost reply rates, zero in on that. If it was about securing more meetings, then meeting conversions are your focus. Avoid getting sidetracked by secondary metrics until you’ve assessed your main objective.
For example, let’s say Variation A achieved a 35% reply rate, while Variation B landed at 20%. That’s a 15 percentage point difference - a 75% relative increase. On the other hand, if the results are closer, like 22% versus 23%, it’s likely just noise, not a meaningful gap.
To ensure reliability, test each variation with at least 100 prospects over a two-week period. This helps smooth out fluctuations caused by factors like timing or holidays. Smaller sample sizes or shorter timeframes can lead to misleading results.
Also, make sure both versions were tested on comparable audiences at the same time. If one group included more senior decision-makers or was contacted during a busy period (like the end of a quarter), your results could be skewed. Double-check your documentation to confirm the test was fair.
If the results are inconclusive or differences are minimal, you’ve got options: extend the test for another week, increase the sample size, or move on to a different variable. Even when a hypothesis doesn’t pan out, it’s still valuable information.
Quantify the improvement to understand its impact. For instance, if your baseline reply rate was 18% and the winning variation hit 28%, that’s a 10 percentage point increase - a 56% relative jump. Scaling that improvement across hundreds or thousands of prospects could significantly impact your pipeline.
Document everything - key metrics, audience details, and insights. This becomes your messaging playbook, helping you avoid repeating mistakes and preserving what works for future campaigns.
Scale the Winning Variation
Once you’ve identified the winner, it’s time to put it to work. The top-performing message should now serve as your default template for that specific audience.
Start small with a pilot rollout - targeting 500 to 1,000 prospects. Monitor your key metrics closely to confirm the message performs well at scale. If the results hold steady or improve, you’re ready to expand.
Next, make the winning message your standard template for all campaigns targeting that persona. Update your automation tools (like SalesMind AI) with the new sequence and ensure your sales team knows this is now the go-to message.
Set performance benchmarks to catch any drops early. For example, if the test showed a 25% reply rate and a 10% positive reply rate, use those as your minimum thresholds. A significant drop could signal message fatigue, seasonal factors (like the Thanksgiving holiday in the U.S.), or shifts in audience behavior.
SalesMind AI’s unified inbox and real-time tracking make it easier to monitor large-scale campaigns. You’ll quickly spot when a message starts to plateau and needs adjustments. Additionally, tools like lead scoring can help you evaluate whether the quality of responses remains strong as you scale.
Keep the core winning element intact. If referencing a prospect’s LinkedIn post boosted replies, maintain that personalization approach. While minor tweaks for different industries or roles are fine, don’t stray from the strategy that delivered results.
Iterate for Continuous Improvement
A/B testing isn’t a one-time task - it’s an ongoing process. Once you’ve scaled a winning message, it becomes your new control for future tests. From there, experiment with other variables.
For example, if you optimized the opening line, focus next on the call-to-action. If you’ve improved the CTA, try tweaking the message length or tone. This systematic approach ensures each test builds on the last, driving steady improvements over time.
A simple monthly test cycle works for most teams:
- Week 1: Review last month’s metrics, identify weak points (e.g., low reply rates or meeting conversions), and define a hypothesis.
- Weeks 2-3: Run the test.
- Week 4: Analyze results, update your control message if there’s a new winner, document insights, and plan your next test.
Having a structured test roadmap keeps your efforts focused and prevents random experimentation. Here are two sample roadmaps:
- Roadmap A (early-stage teams): Start with your subject line or opening hook to improve message open rates. Then test your value proposition - e.g., cost savings versus revenue growth. Finally, experiment with different CTAs, like a “15-minute intro chat” versus “book a demo.”
- Roadmap B (more mature teams): Begin with message length, comparing concise two-to-three sentence versions to detailed six-to-eight sentence ones. Next, test personalization depth - light touches like mentioning a company versus deeper references to recent achievements. Finish by testing timing, such as mornings versus afternoons or mid-week versus Mondays and Fridays.
Maintain a backlog of hypotheses to keep the momentum going. Ideas like “shorter messages will boost replies” or “mentioning a mutual LinkedIn group will improve acceptance rates” provide a steady pipeline of experiments.
Leverage automation and AI tools to speed up the process. Platforms like SalesMind AI can analyze thousands of interactions weekly, offering real-time insights into what’s working and suggesting new angles to test. This accelerates the testing and iteration cycle.
Make testing a consistent part of your workflow. Teams that treat A/B testing as a routine practice gain an edge over time. Each winning variation becomes the new baseline, and every test adds another layer of refinement to your outreach strategy.
Conclusion
Taking the results of your test analysis into account, these final insights can help refine your LinkedIn outreach strategy. A/B testing transforms guesswork into a clear, data-backed process. Instead of wondering why your messages aren’t landing or why connection requests are ignored, you’ll gain actionable insights supported by real performance metrics. Each test helps you better understand your audience, turning small tweaks into measurable gains when applied across hundreds - or even thousands - of prospects. By setting clear goals, isolating variables, and scaling effective messages, you create a feedback loop that strengthens your outreach over time.
The real magic happens when this becomes a consistent practice, not just a one-off experiment. Teams that regularly test, document, and refine their approach develop a messaging playbook that grows stronger with each iteration. Every successful variation becomes the foundation for future improvements.
Key Takeaways
- A/B testing eliminates guesswork. Instead of relying on assumptions or copying someone else’s approach, you’ll use hard data to discover what resonates with your audience.
- Test one variable at a time with clear goals. Whether it’s the subject line, personalization style, or call-to-action, isolating variables provides precise insights for future campaigns. Always define success metrics upfront, such as connection acceptance rates, reply rates, or meetings booked.
- Ensure a large enough sample size and adequate test duration. Testing with at least 100 prospects per variation over one to two weeks ensures your results are reliable and not just random fluctuations. Smaller samples or shorter timeframes can lead to misleading conclusions.
- Scale successful messages and keep testing. Once you identify a winning message, make it your go-to template for larger campaigns. Then, use it as the new baseline for testing another variable. This ongoing cycle of testing and refining turns incremental improvements into major gains in pipeline and revenue.
This systematic approach ensures you’re not just sending messages into the void. Instead, you’re building a dependable, repeatable process that improves with each iteration, transforming LinkedIn outreach into a powerful growth channel.
Next Steps
Ready to put this into action? Start your first A/B test today. Choose one clear goal, such as boosting your reply rate. Then, select a single variable to test - like a personalized opening line compared to a generic greeting. Create two message versions, split a list of 200+ prospects into two similar groups, and send both versions simultaneously over one to two weeks. Monitor your key metrics, analyze the results, and apply the winning version to your next 500 to 1,000 prospects.
For example, testing a personalized opening against a generic greeting could reveal surprising insights into what gets your audience to engage.
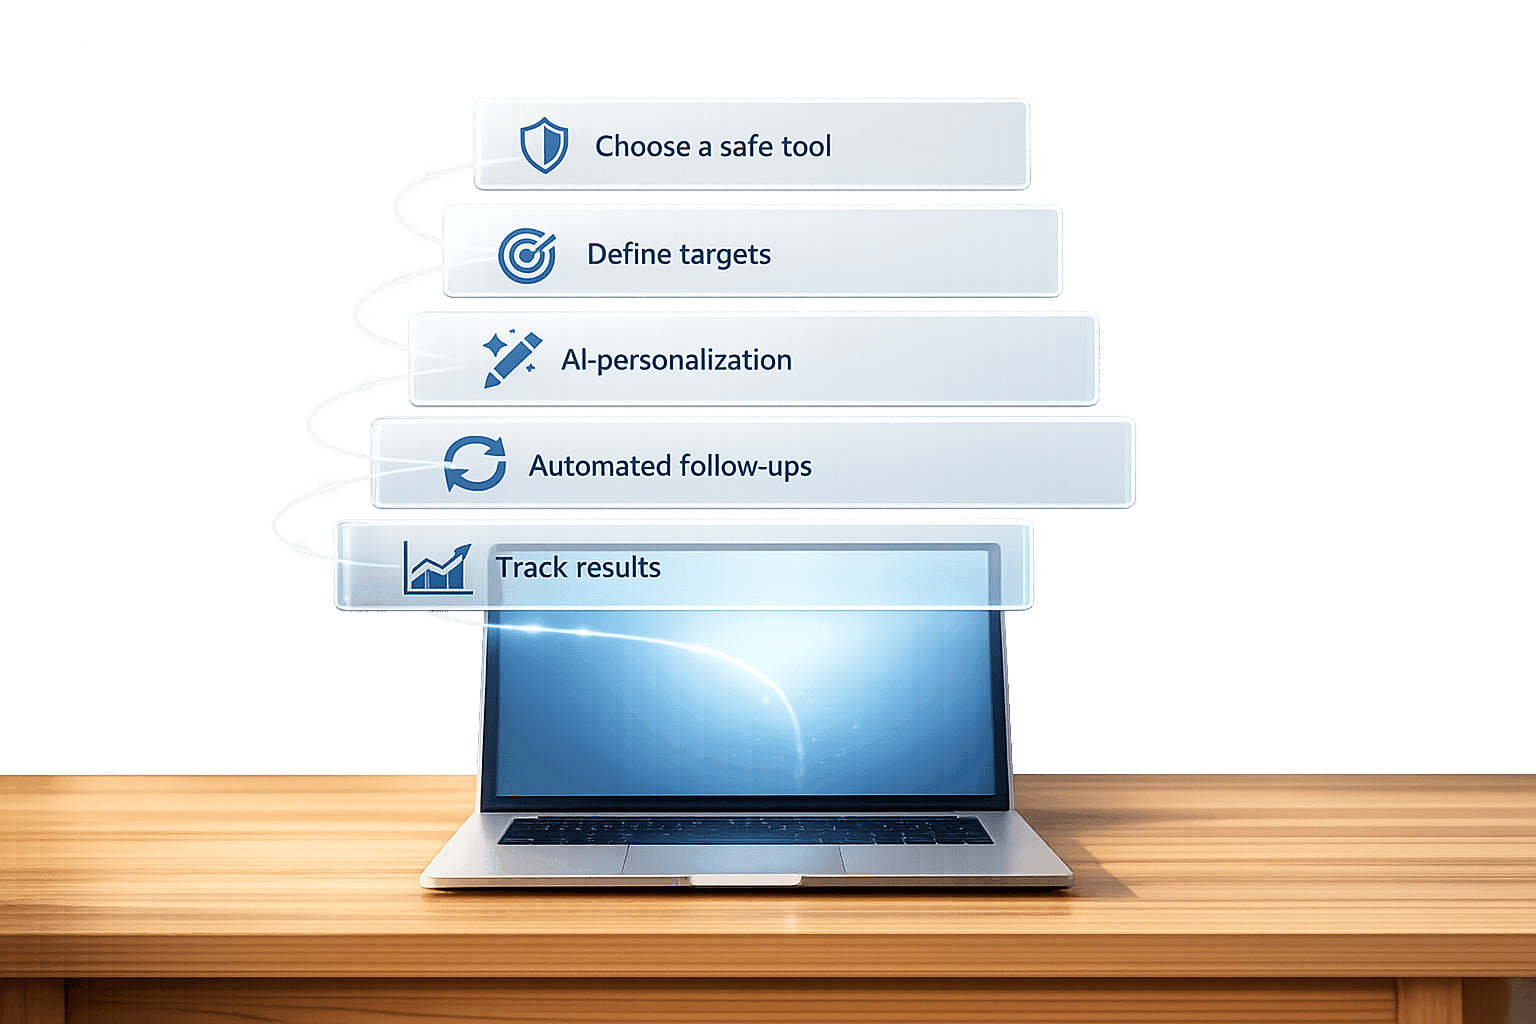
Tools like SalesMind AI (https://sales-mind.ai) make this process easier by automating LinkedIn outreach at scale. With built-in testing features, you can create multiple message variations, automatically divide prospects into test groups, and send campaigns with precise timing. The platform tracks key metrics like connection acceptance rates, reply rates, and meetings booked, all within an AI-powered inbox. It also offers advanced lead scoring to prioritize high-intent prospects, while native LinkedIn integration ensures seamless delivery. By reducing manual effort and improving consistency, tools like this allow you to run more tests and gather insights faster.
Once your first test is complete, keep the momentum going. Experiment with a different variable, like testing call-to-actions - compare “Can I share a quick idea?” to “Are you available for a 15-minute call?” Expand your winning variation to larger campaigns, keeping an eye on performance to ensure it scales effectively. Start building a simple playbook of winning templates, documenting the hypothesis, sample size, duration, and results for each test. Over time, this playbook becomes a powerful resource for training new team members and scaling outreach across different audiences or industries.
Aim to conduct one or two tests each month, updating your templates based on what works best. By making testing a habit, you’ll gain a compounding advantage, with every improvement building on the last. This steady refinement drives consistent growth in meetings, pipeline, and revenue.
FAQs
What mistakes should I avoid when running A/B tests on LinkedIn messages?
When running A/B tests for LinkedIn messages, there are a few missteps you’ll want to steer clear of to ensure your results are reliable and useful:
- Testing too many variables at once: Stick to tweaking one key element at a time - like the subject line or call-to-action. This way, you’ll know exactly what’s driving any changes in performance.
- Using a sample size that’s too small: Make sure each test group includes enough recipients to yield results you can trust. Tiny sample sizes often lead to misleading conclusions.
- Focusing only on open rates: While open rates matter, don’t stop there. Pay attention to additional metrics like responses, engagement levels, and conversions to fully understand how effective your message truly is.
By steering clear of these mistakes, you’ll be better equipped to fine-tune your LinkedIn outreach and achieve stronger results.
How do I make sure my A/B test results for LinkedIn messages are accurate and meaningful?
To make sure your A/B test results are trustworthy, stick to these essential practices:
- Test one variable at a time: Change only one element in your LinkedIn messages - like the subject line or call-to-action - so you can clearly see what’s driving the results.
- Use a large enough sample size: Send your messages to a big enough group of recipients to reduce the influence of random chance. Bigger samples lead to more reliable and meaningful results.
- Give the test enough time: Let your test run long enough to collect solid data. Cutting it short could lead to conclusions that don’t reflect the real picture.
- Track the right metrics: Pay attention to the numbers that matter for your goals. Whether it’s response rates, accepted connection requests, or click-through rates, focus on what aligns with your objectives.
By sticking to these steps, you can figure out which LinkedIn message variations work best. Tools like SalesMind AI can simplify your outreach and automate A/B testing, giving you insights to fine-tune your campaigns.
What are the best practices for scaling a winning LinkedIn message?
Once you've crafted a LinkedIn message that works, the next step is scaling it up effectively. Start by fine-tuning the message to appeal to a larger audience while keeping the personal touch that made it successful in the first place. Then, consider using tools like SalesMind AI to handle outreach at scale. These tools can help you automate and personalize messages, ensuring consistent quality and timely follow-ups. Finally, keep an eye on metrics like response rates, engagement levels, and conversions. Use this data to tweak your strategy and stay on track. Regular reviews and adjustments will help you maintain momentum as you expand your efforts.
 JG
JG